Viral Load in COVID-19
The FLARE Four
- In most cases of SARS-CoV-2, viral load decreases as adaptive immunity develops
- Severe COVID-19 is also characterized by significantly elevated inflammatory markers (e.g. CRP, IL-6, ferritin), which some speculate reflects an irrationally exuberant immune response
- During the 2003 SARS epidemic, there were reports of poor outcomes with both prolonged and suppressed viral replication, suggesting some patients have poor outcomes due to failure to contain the virus, while some suffer from a maladaptive immune response
- Tonight, we review data on the association of viral load with disease outcome
Many people are asking...is severe COVID-19 due to the virus or the immune response?
Subscribe to the latest updates from FLARE Advances in Motion
Erratum: the FLARE team would like to point out an error regarding viral load testing in COVID-19. In the example used to explain cycle threshold, Sample B, had more starting material. We apologize for any confusion and appreciate that it was brought it to our attention.
How Do Scientists Precisely Quantify the Amount of Virus in a Sample?
For an RNA virus like SARS-CoV-2, quantitation is typically performed by a process known as quantitative reverse transcription-polymerase chain reaction, or qRT-PCR for short (confusingly also sometimes termed “real time” RT-PCR).
Let’s break down this technology:
- PCR: PCR works to amplify bits of pre-specified DNA in rounds of duplication. Importantly, therefore, the amount of DNA (known as “product”) depends both on the amount of starting material (“input”) and the number of rounds (“cycles”). When PCR is perfect, each molecule of template is duplicated in every cycle, such that [product ≅input * 2n] with n = number of cycles. As an example, if we started with 10 molecules of DNA and performed 35 cycles of PCR (fairly standard), we would expect to end up with nearly 350 billion molecules of product! PCR is therefore extremely good at detecting even rare sequences.
- RT-PCR: Amplifying DNA is great, but how does that help us with an RNA virus? Here we take advantage of retroviruses. Retroviruses encode an enzyme called reverse transcriptase which copies RNA into a complementary DNA (or “cDNA” for short). This cDNA can then be used for PCR as outlined in the prior section.
- qRT-PCR: To quantify the amount of RNA or DNA present in a sample, we perform RT-PCR in a special machine that can estimate the amount of product generated at the end of each cycle. As outlined in the first section, the amount of product depends both on the number of cycles of PCR and the amount of starting material. Thus, the number of cycles required to generate a given amount of product serves to tell us about how much starting material there was.
Let’s use some example data (made up in table 1):
If we asked, “How many cycles does it take to get to 1 million copies of product?” we would see that for sample A this took around 17 cycles, but for sample B it only took 11 cycles. This tells us sample B had many more copies of starting material (50 times as much in this case). Calculating exactly how much more can be tricky, so often people just report the number of cycles instead - we call that the “cycle threshold” or “Ct value”. Like in our example, a low Ct value implies more input template and vice versa.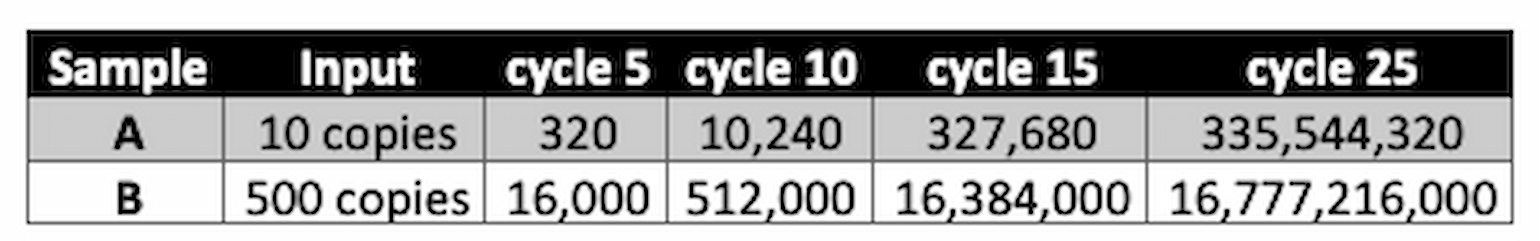
Table 1
- A final term you may encounter is “delta Ct”, abbreviated ΔCt or dCt. dCt attempts to correct Ct values for a variable we have not yet addressed - how much starting material was used for the reaction? For example, qRT-PCR from a vigorous nasal swab might yield more measured SARS-CoV-2 than from a less vigorous one - even if the “real” amount of virus were identical in the two samples. To account for this possible measurement confounder, dCt adjusts the measurement using a second, unrelated DNA sequence that should be present in all samples at the same concentration. In principle, dCt is therefore a more reliable measurement.
Aficionados only: How is the amplified DNA quantified exactly?
Quantitation of product is typically done in one of two ways. In the first, intercalating fluorescent dyes (ex. SYBR Green) are included in the PCR reaction. These dyes have the unique and useful property of emitting light only when bound to double-stranded DNA. As PCR product is generated, the amount of fluorescence increases and is measured during each cycle by the qPCR instrument. The second quantitation method takes advantage of fluorescent probes (ex. TaqMan assays). These probes are engineered to emit light only when they find and bind to a specific DNA sequence. By including a probe specific to the DNA sequence being amplified in the PCR, the amount of product can be very accurately quantitated cycle by cycle.
Putting it all together: qRT-PCR allows us to measure viral RNA in a sample. Ct represents an estimate (lower Ct = more RNA, higher Ct = less RNA) but is subject to normalization errors based on sampling differences. dCt tries to account for this issue, but this is not a perfect method and, more importantly, several of the papers discussed herein do not report ΔCt in any case.
Many People are Saying (When Asked About the Severity of the Disease)...It's the Virus
The quantity of virus (as estimated by Ct value) in patients infected with SARS-CoV-2 is highly variable, but is thought to peak within the first week after symptom onset. For example, Zou and colleagues reported viral load (by nasopharyngeal swab qRT-PCR) on 18 patients from China (Zou et al., 2020). The below figure illustrates the variability in viral load (estimated by Ct value) over time in these patients with peaks ranging from days 5-9.
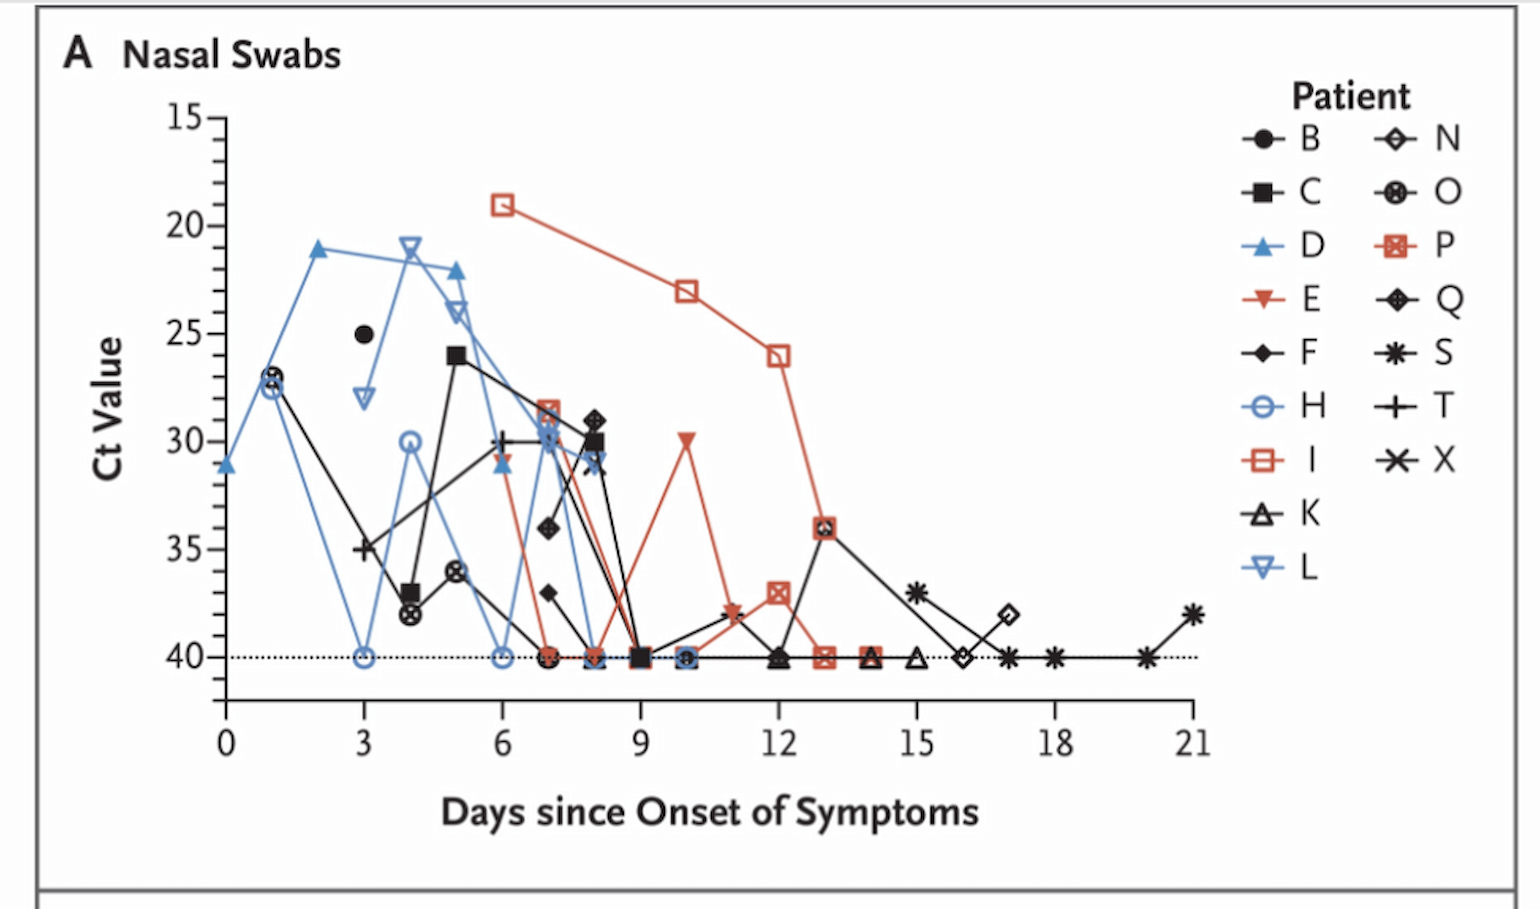
Figure 1
A recent report in Lancet Infectious Disease (Liu et al., 2020) suggests that severe cases have higher initial viral load and delayed viral clearance.
Liu and colleagues report results from 76 patients with SARS-CoV-2 infection confirmed by qRT-PCR. 61% of patients were defined as clinically mild and 39% as severe (defined as hypoxemia, clinical respiratory distress, P:F < 300, respiratory failure, or other organ failure at any point during the admission. 77% of severe cases required ICU care). Of note, severe cases were older (55.6 +/-15.1, compared to 43.6 +/- 14.4). They found:
- Sixty-fold higher initial viral load (quantified by ΔCt, which reflects a logarithmic transformation of the underlying viral abundance) in severe cases as compared to mild cases.
- Severe cases had delayed viral clearance (note that lower values mean fewer cycles needed for viral RNA detection and thus higher viral load). The authors studied a subset of patients with serial sampling (21 mild and 10 severe) and found that while 90% of mild cases were actually PCR negative by day 10 from symptom onset, all severe cases had positive PCR beyond day 10.
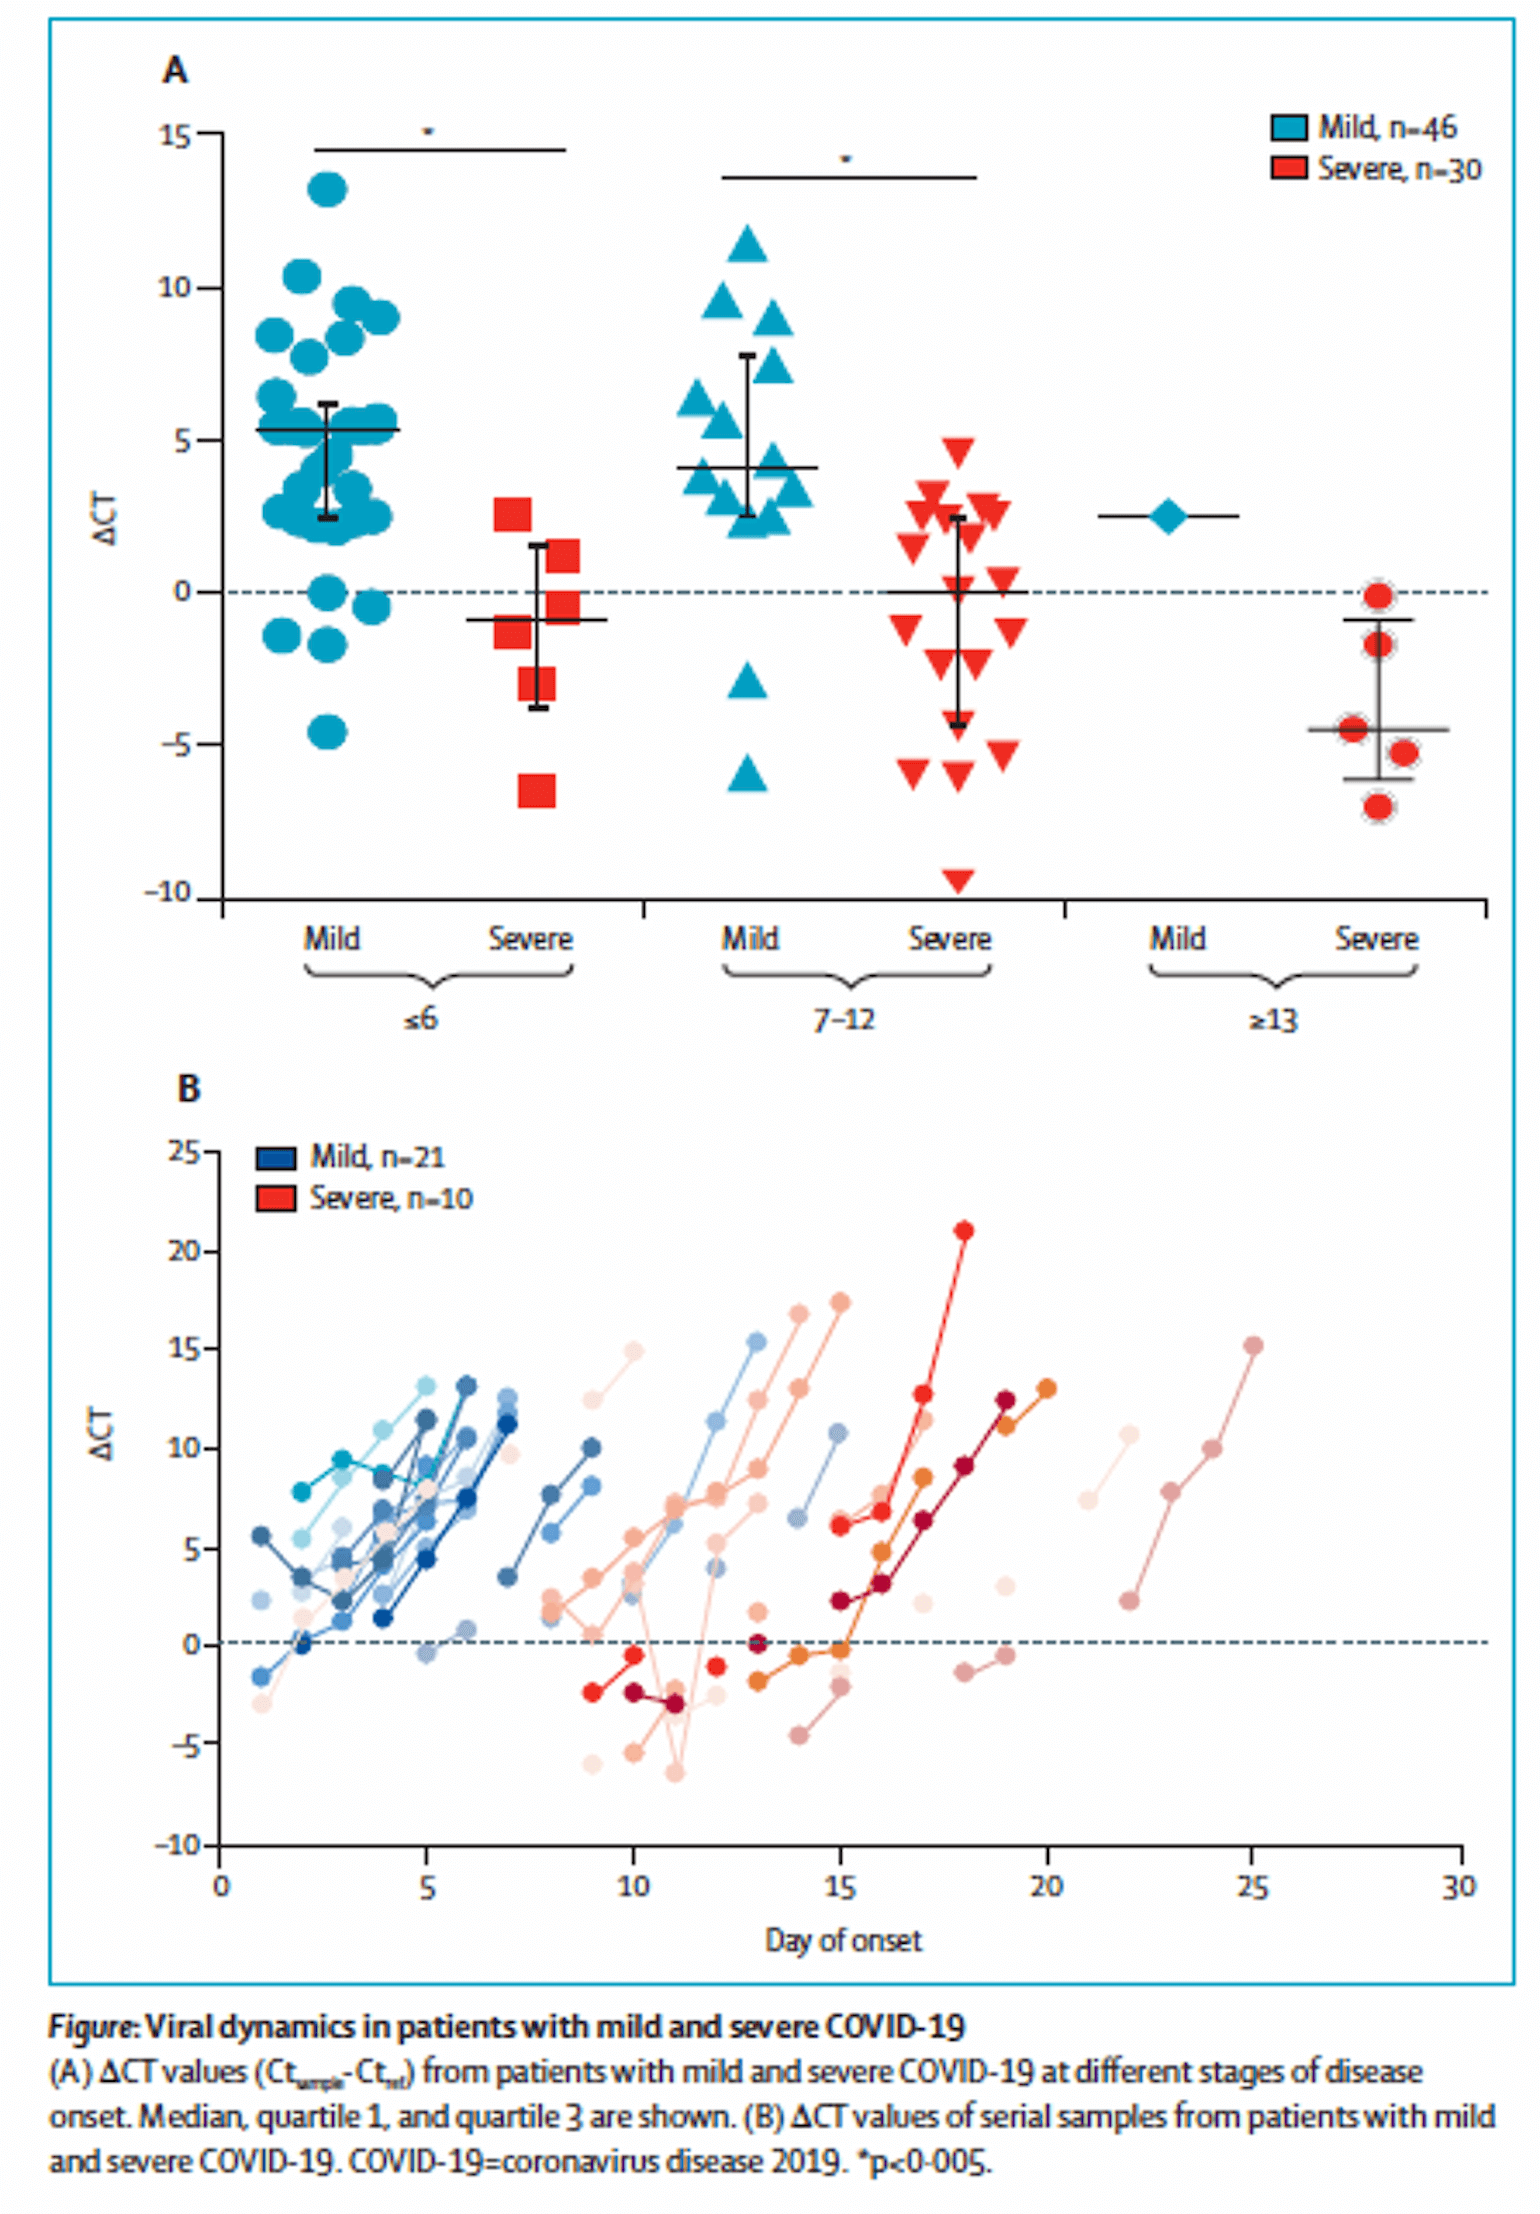
Figure 2
What are the Data from SARS-CoV-1?
Similar reports on surrogate measures of viral load and clearance were published during the outbreak of SARS due to SARS-CoV-1. Chu and colleagues (Chu et al., 2004) reported an analysis of 133 patients with SARS-CoV-1, confirmed by paired serologic testing and qtPCR. 32 patients (24.1%) met criteria for Acute Respiratory Distress Syndrome (ARDS) and 24 (18%) died. They found that age, presence of co-morbidities and initial viral quantification amount were risk factors for death. A Kaplan-Meier plot of survival comparing initial viral RNA quantity is shown below:
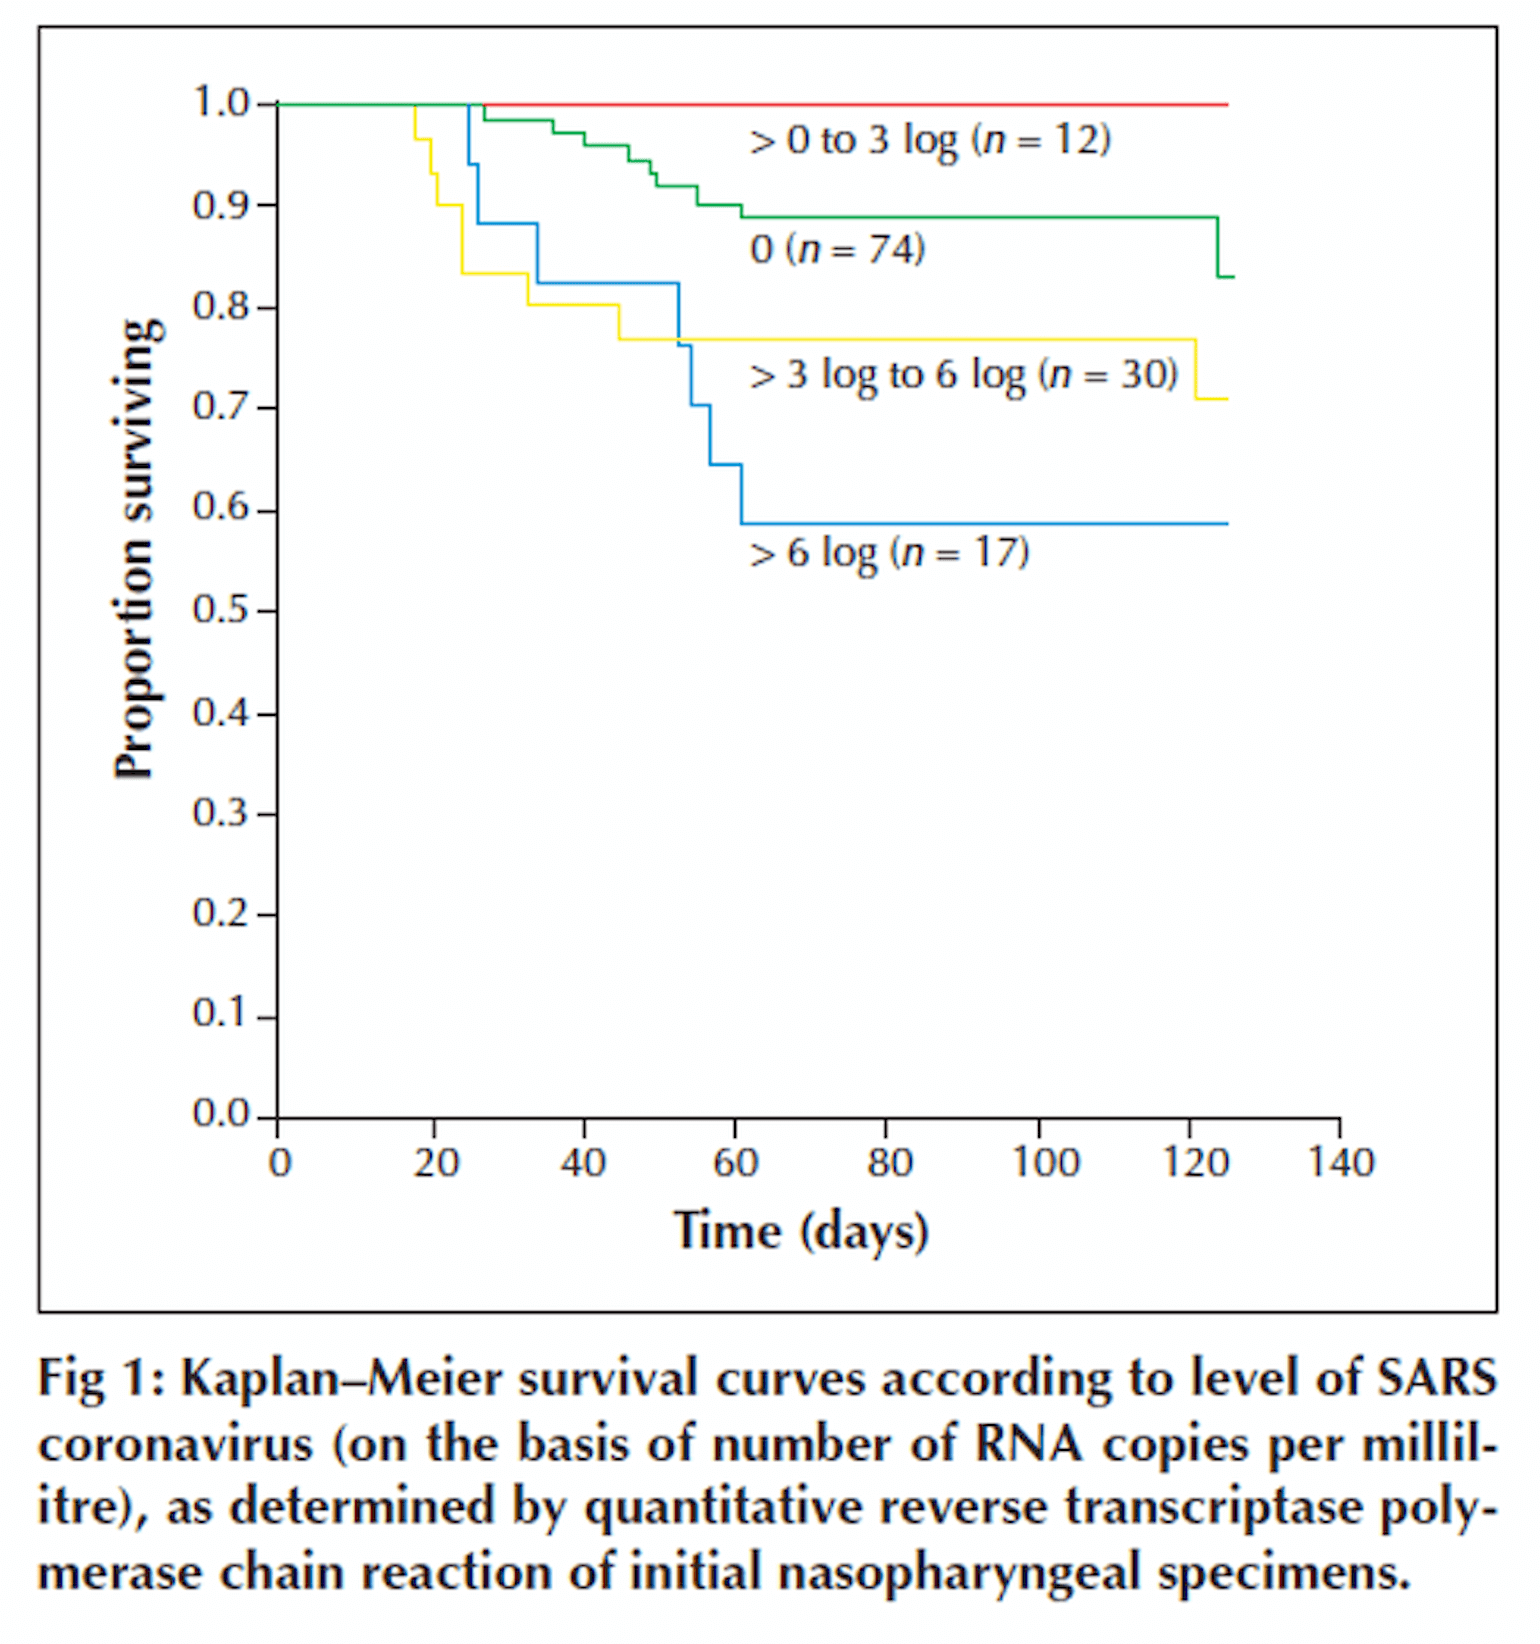
Figure 3
Time is counted from the day of symptom onset.
Many People are Saying...It's the Immune Response...Maybe
Peiris and colleagues (Peiris et al., 2003) tracked symptoms, viral load and the development of positive serology for IgG over the course of 3 weeks in 75 patients from a single-community outbreak of SARS-CoV-1 in Hong Kong. They found persistent elevated viral load (again quantified by qRT-PCR) to 14 days and also noted a decrease in viral load the was temporally related to an increase in IgG:
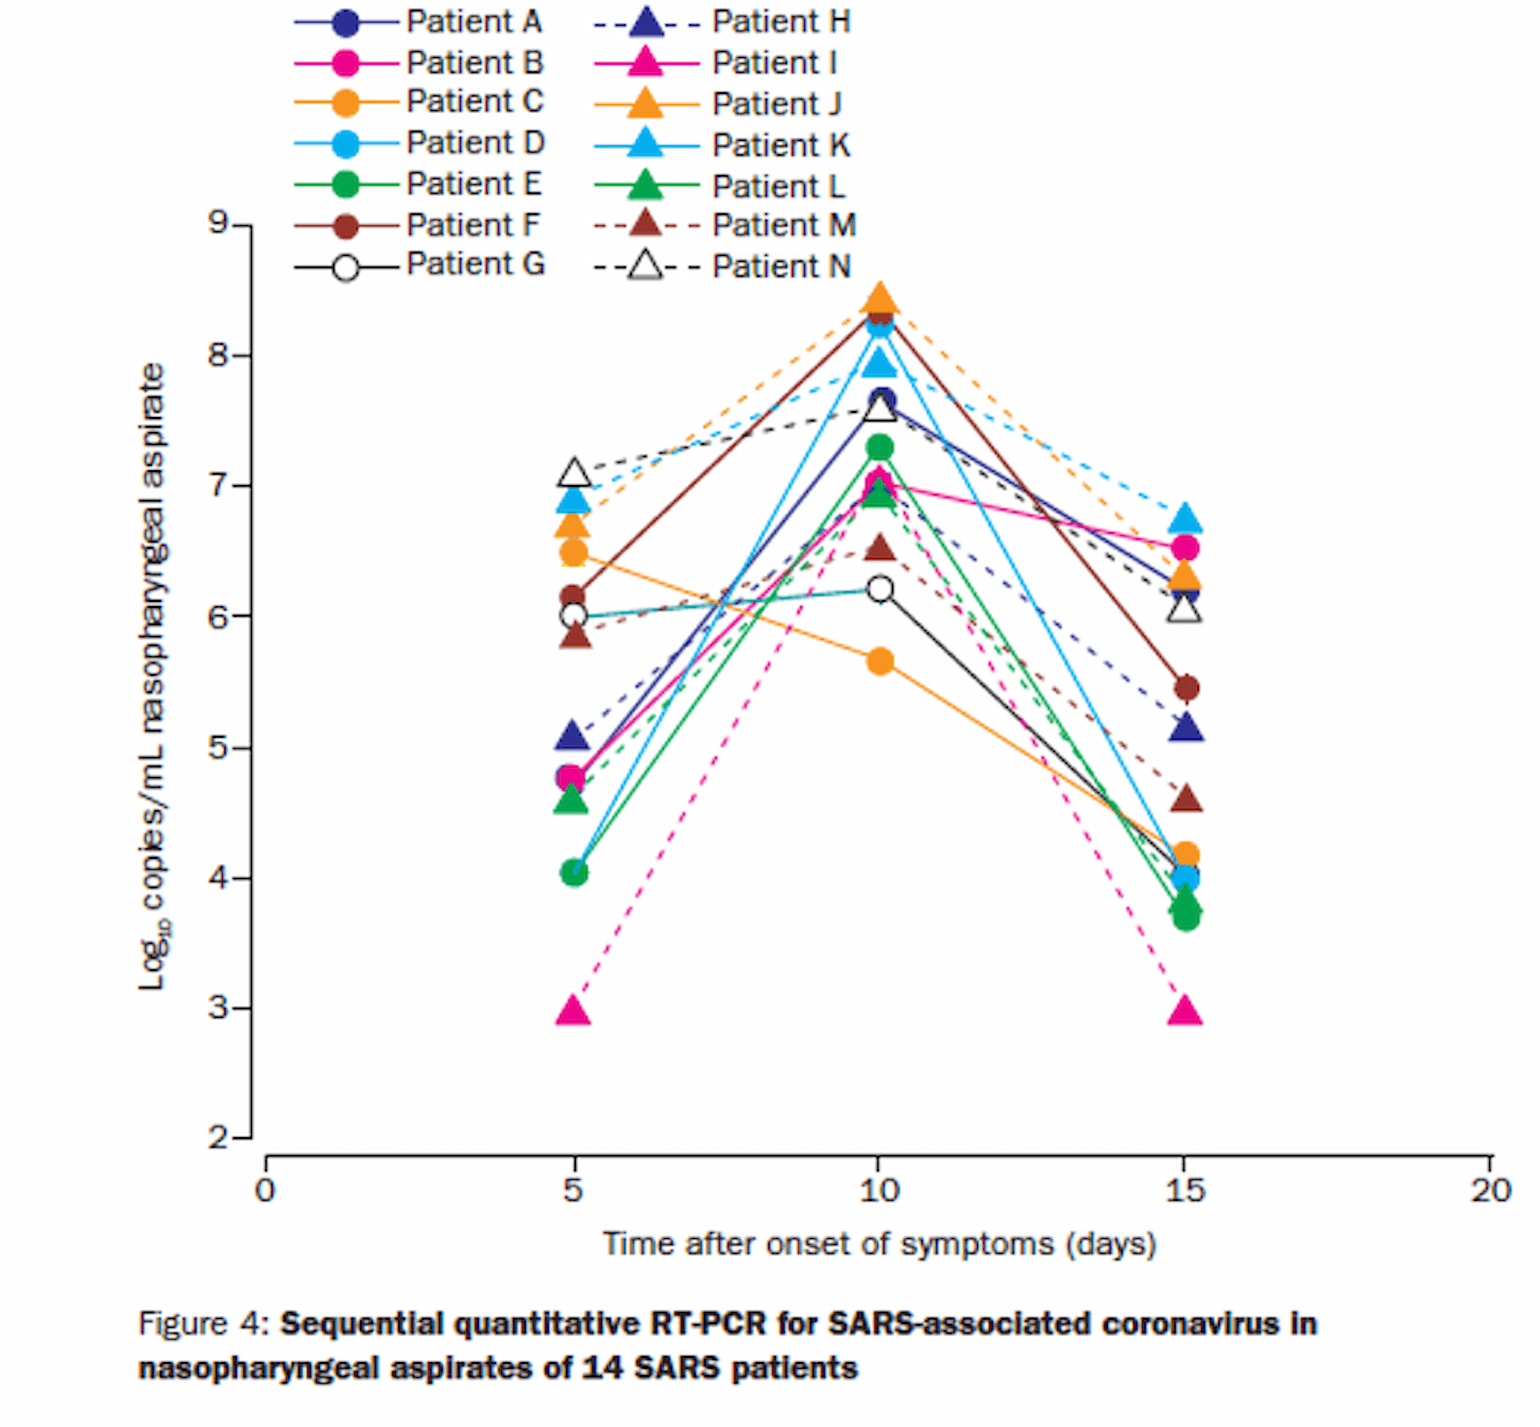
Figure 4
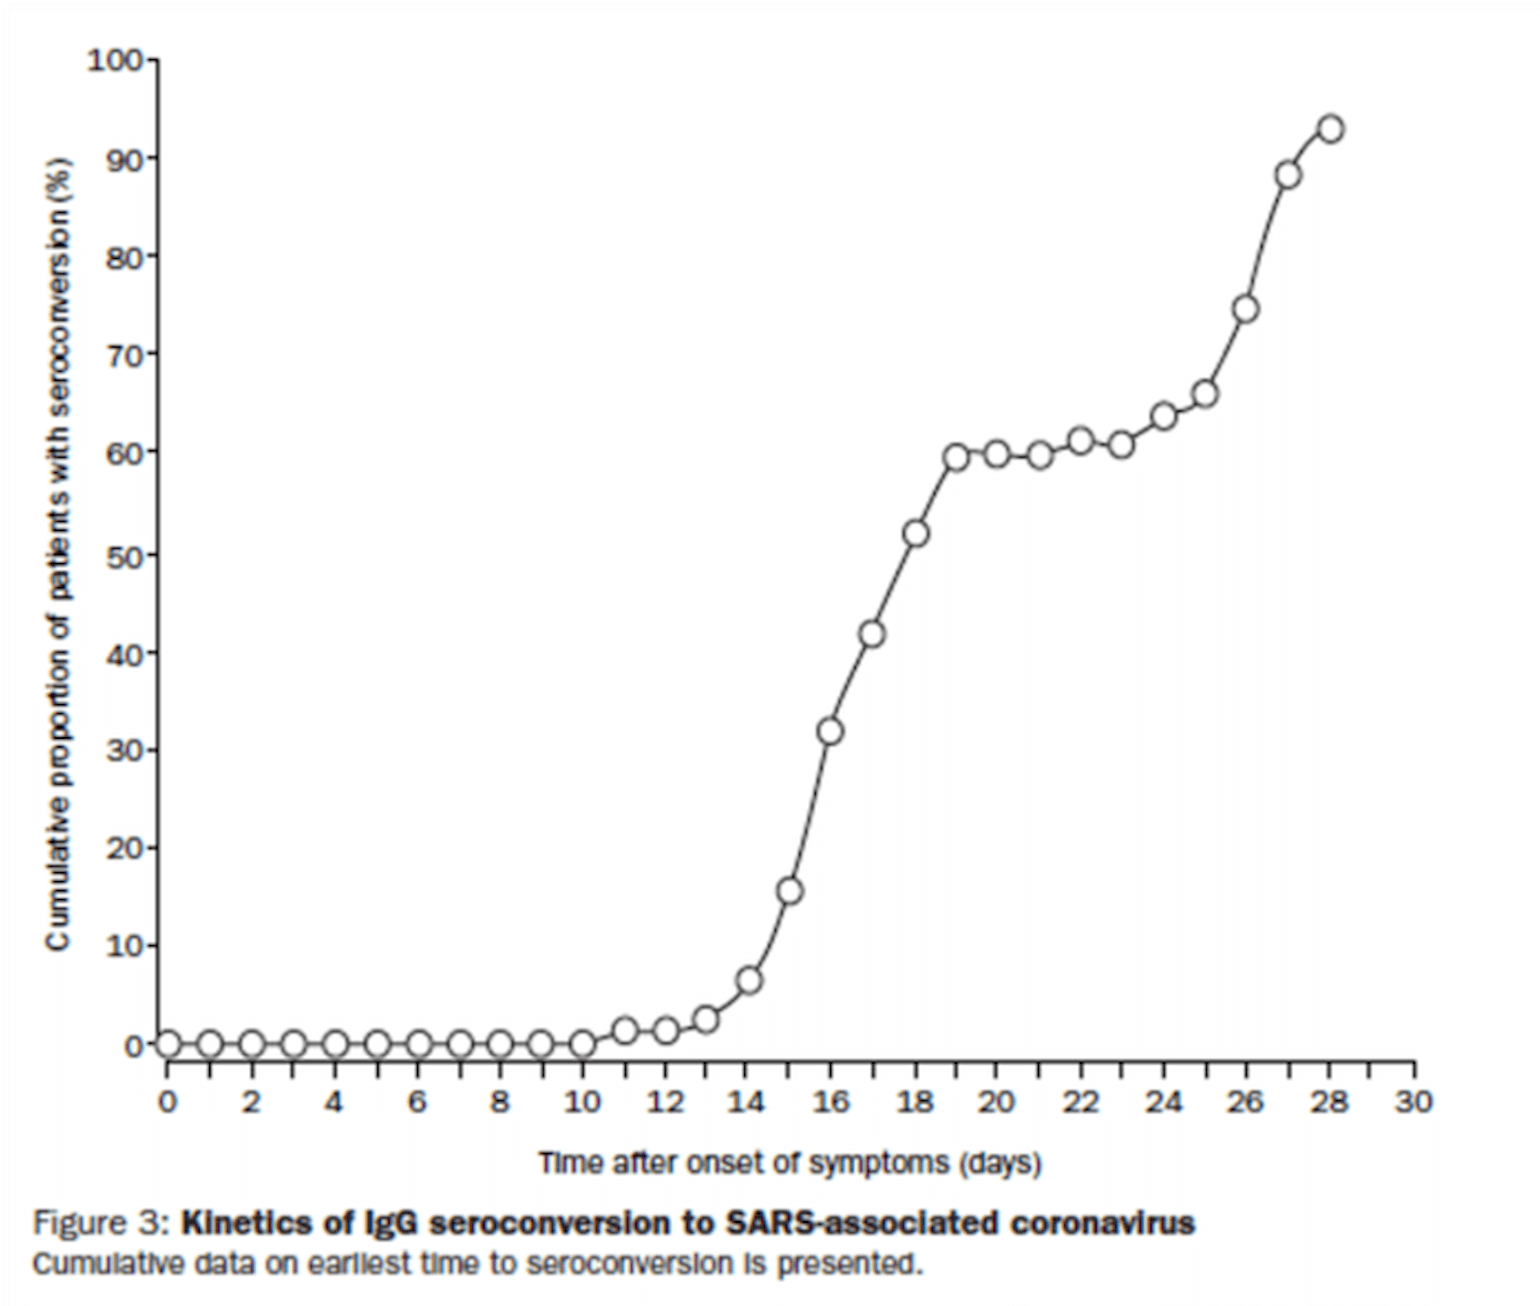
Figure 5
By day 15, most patients had a lower viral load than at admission. While most patients had a mild course, 15 patients (20%) developed ARDS. Those who did reported a biphasic course of symptoms with ARDS developing later in the course of illness in week 3. This finding led the authors to speculate that the late ARDS may have been related to a maladaptive immune response, though this interpretation is certainly complicated by the continued viral load during that phase of illness, and thus the hypothesis of maladaptive immune response, is just that, a hypothesis.
Conclusion
Most patients with SARS-CoV-2 infection experience rapid viral clearance. Viral load declines in concert with the development of an effective immune response. Some patients, however, have a more severe course, which begs an important question: is this more severe presentation due to failure to mount an effective immune response or to immune-mediated illness? As we consider immunomodulation therapy for COVID-19, the data on SARS-CoV-2 from Liu and colleagues, and from a retrospective analysis of SARS-CoV-1, are an important caution that severe disease may, in fact, be due to failure to clear the virus. At this time, however, we truly do not know the answer to this crucial question.
References
- Chu, C.-M., Poon, L.L.M., Cheng, V.C.C., Chan, K.-S., Hung, I.F.N., Wong, M.M.L., Chan, K.-H., Leung, W.-S., Tang, B.S.F., Chan, V.L., et al. (2004). Initial viral load and the outcomes of SARS. CMAJ 171, 1349–1352.
- Liu, Y., Yan, L.-M., Wan, L., Xiang, T.-X., Le, A., Liu, J.-M., Peiris, M., Poon, L.L.M., and Zhang, W. (2020). Viral dynamics in mild and severe cases of COVID-19. Lancet Infect. Dis.
- Peiris, J.S.M., Chu, C.M., Cheng, V.C.C., Chan, K.S., Hung, I.F.N., Poon, L.L.M., Law, K.I., Tang, B.S.F., Hon, T.Y.W., Chan, C.S., et al. (2003). Clinical progression and viral load in a community outbreak of coronavirus-associated SARS pneumonia: a prospective study. Lancet 361, 1767–1772.
- Zou, L., Ruan, F., Huang, M., Liang, L., Huang, H., Hong, Z., Yu, J., Kang, M., Song, Y., Xia, J., et al. (2020). SARS-CoV-2 Viral Load in Upper Respiratory Specimens of Infected Patients. N. Engl. J. Med. 382, 1177–1179.
View all COVID-19 updates
Learn about research in the Division of Pulmonary and Critical Care Medicine